June 02, 2023 | 📊 Personal Productivity Charts with Python
Personal Productivity Charts
Spent entirely too long to make this chart to look at how effective my GTD workflows are.
- I exported data from my to-do task manager (Gqueues) to csv
See Using Gqueues for GTD for my GTD methodology.
-
Used the Python library Pandas to massage the data into something the bar chart function can use
-
customized the chart to make it somewhat legible
-
there is some data cleanup to do
I've hidden the legend of category/colors in this chart to keep personal stuff safe, but each of the colors in the bar segments represents a different priority in my life.
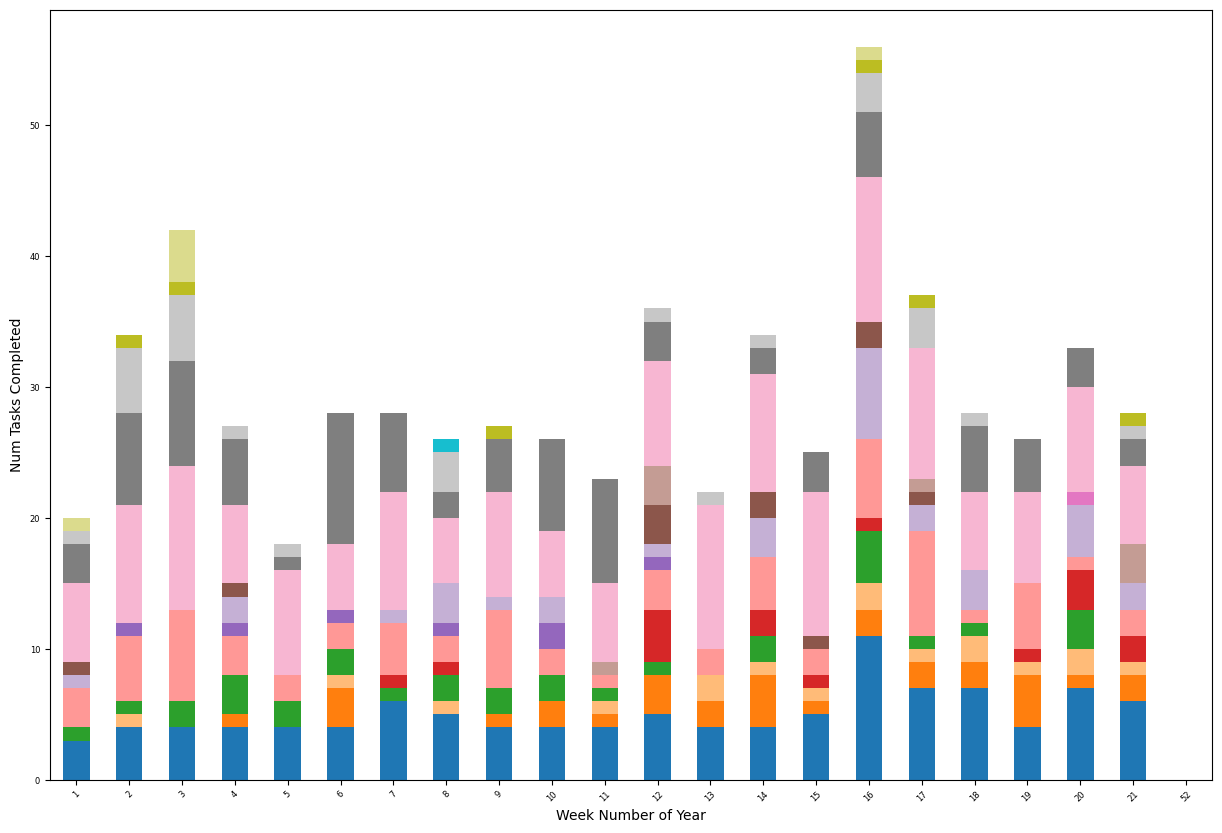
It is was a fun Coding exercise in which I got to exercise long-atrophied Python muscles. It yielded interesting insights, but I'm unclear if anything I noticed will greatly change any behaviors going forward.
I think most of all this initial draft shows a benchmark of where my "natural" ratios of task categories are at. If there is a notable deviation in future versions of this chart, I'd expect to be able to explain it with a change in priorities or use it as feedback that I need to re-consider my priorities.